Tutorial: Visualizing your first results
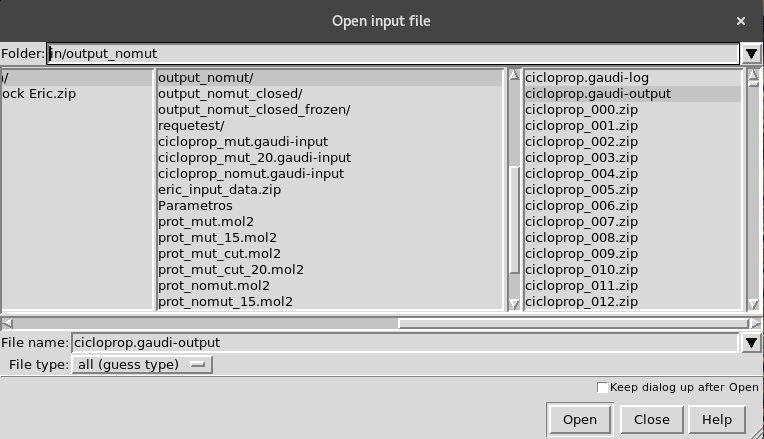
When a GaudiMM job finishes correctly, you will find the results in the directory specified at output.path. There you will find:
*.gaudi-input. An (updated) copy of the input file used in this job, for reproducibility purposes.*.gaudi-log. A detailed log of the simulation, for debugging purposes.*.gaudi-output. A YAML file with the scores and paths of the solutions.- (Potentially lots of)
*.zip. As many as the elite population size. Each zip contains an Individual, which means that you will find molecule files (normally, mol2 files), as well as the allele metadata of the rest of the genes.
To analyze the results, currently the best tool is our own extension for UCSF Chimera, GaudiView. After installing it, you can type the following:
gaudi view *.gaudi-output
, and hopefully it will open Chimera and GaudiView to load the output file. If it doesn’t work (please, if that’s the case, report it in the issues page!), you can always UCSF Chimera, fire up GaudiView from Tools> InsiliChem> GAUDIView and browse the file manually.
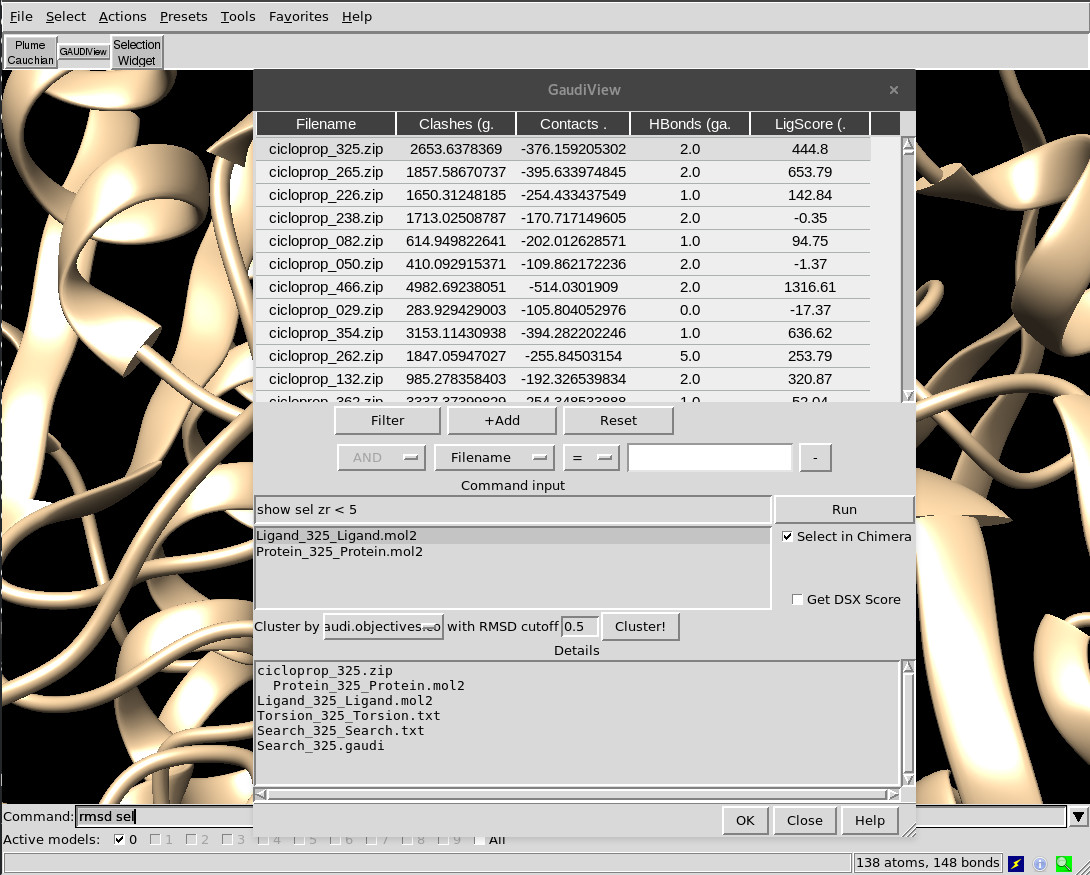
One way or another, you will end up seeing the following dialog:
Actions
The following actions are available:
Depiction
Clickon a row to show that solution as is.Double-clickmay trigger additional post-processing as detailes in the genes metadata, depending on the chosen genes.Ctrl-clickorShift-clickto select more than one solution at the same time.- Use
upanddownarrows to move along the list.
Sorting
- Click on the column headers to sort by that key.
Filtering
- Press
+Addto load a new filter. Select the filter key, specify the cutoff and pressFilter. Repeat to add more filters with the selected boolean. - Remove filters by pressing on -.
- Clear all the filters with
Reset.
- Press
Commands
- Every time you change the selected row, the command specified in the command input panel will be run. You can force it by pressing
Enterkey or click onRun. - Combine the command line with the dynamic selection panel to run commands like
show sel zr < 5to depict the surrounding residues of docking poses. - Multiple commands can be chained with
;.
- Every time you change the selected row, the command specified in the command input panel will be run. You can force it by pressing
Clustering
- First, choose the column to use as energy criteria.
- Select the RMSD cutoff. If two solutions have RMSD bigger than this value, they won’t be considered similar and thus not clustered together.
- Press
Cluster!. Since this method requires to load all solutions at once, it can take some time if you have a lot of solutions. - When it’s done, a new column
Clusterwill be available at the end of the table. Sort by that column to group them together andShift-clickto depict the full cluster.
When you are done with the analysis, you can exit GaudiView in different ways:
- Click
OK. The depicted solutions at that moment won’t be closed, and thus available for further post-processing in Chimera. Every other solution previously loaded will be removed from the canvas and closed. - Click
Closeor upper-cornerX. All solutions, visible or not, will be removed from canvas and closed.
Error
There’s a known bug in GaudiView that may trigger a non-critical exception if you filter the solutions and then try to sort them again without selecting a new row beforehand. You can dismiss the dialog and simply click in any row to avoid this bug. It will be fixed soon, promise!